For recruiters, time is their most valuable asset. Their days are filled with finding clients who need hires and matching them with the right candidates. While they excel at building relationships and understanding client needs, tracking the effectiveness of their marketing efforts often falls to the wayside.
The Challenge
A small recruitment firm that had quadrupled in size over four years came to me with a common problem: they couldn’t tell which channels were driving quality applications. Despite implementing Google Analytics 4 (GA4) early in their growth journey, their recruiters found themselves struggling to interpret the data. With multiple traffic sources, including LinkedIn, organic search, and in-person events, they needed a clear way to track conversion flow and measure channel effectiveness.
The Solution
Together, we approached this challenge in three key phases:
1. Data Organization & Visualization
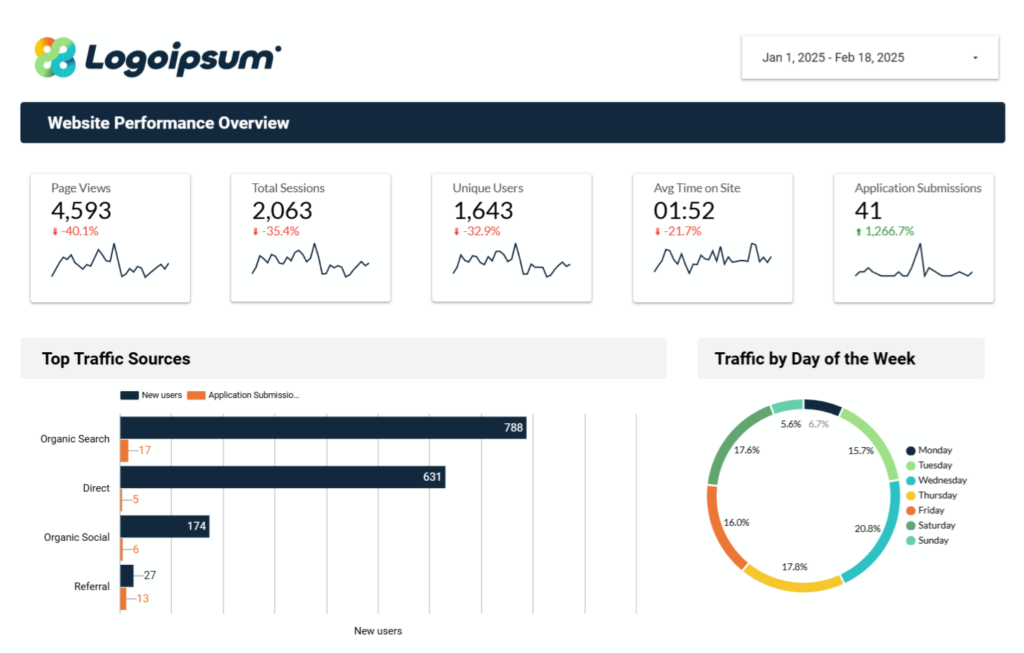
We created a custom dashboard focusing on application conversion flow, designed with a clear hierarchy. Executive-level metrics like total applications were immediately visible, with the ability to dive deeper into job posting performance, traffic patterns, and geographic distribution of website visitors.
2. Strategic Metric Selection
Through stakeholder conversations, we identified the metrics that truly mattered: traffic source attribution, conversion rates by channel, and geographic performance patterns. This transformed complex GA4 data into actionable insights using Looker Studio that aligned with their business goals.

3. Implementation & Results
The dashboard revealed not only top-performing traffic sources but also uncovered seasonal patterns and trends. We streamlined the conversion tracking process and implemented automated monthly reporting to ensure consistent monitoring.
See the solution in action: View Interactive Dashboard
The Impact
The team gained confidence in their marketing decisions, doubling down on successful strategies like LinkedIn job postings and targeted SEO tactics. The dashboard’s accessibility encouraged regular data checks, and most importantly, gave them the confidence to test new initiatives while clearly measuring the results.
Key Takeaways:
- Simplified analytics lead to better decision-making
- Regular data monitoring becomes effortless with the right dashboard
- Clear metrics help identify which marketing efforts drive real results
- Visual organization of data encourages team-wide engagement
Ready to transform your marketing data into clear business decisions? Let’s talk about creating a dashboard that tells your story. View our sample dashboard and schedule a call to discuss your needs.


